

Auto loan delinquencies can increase collection costs, erode lender profitability, and expose weaknesses in underwriting and portfolio management. As missed payments accumulate, lenders face a greater risk of defaults and credit losses.
Keeping up with auto loan delinquency statistics helps lenders spot changes in repayment patterns, evaluate portfolio exposure, and determine where underwriting or servicing practices may need attention.
This report examines 2026 auto loan delinquency statistics, including national trends, prime and subprime performance, differences across borrower age groups, and the implications for lenders managing credit risk.
Key Takeaways
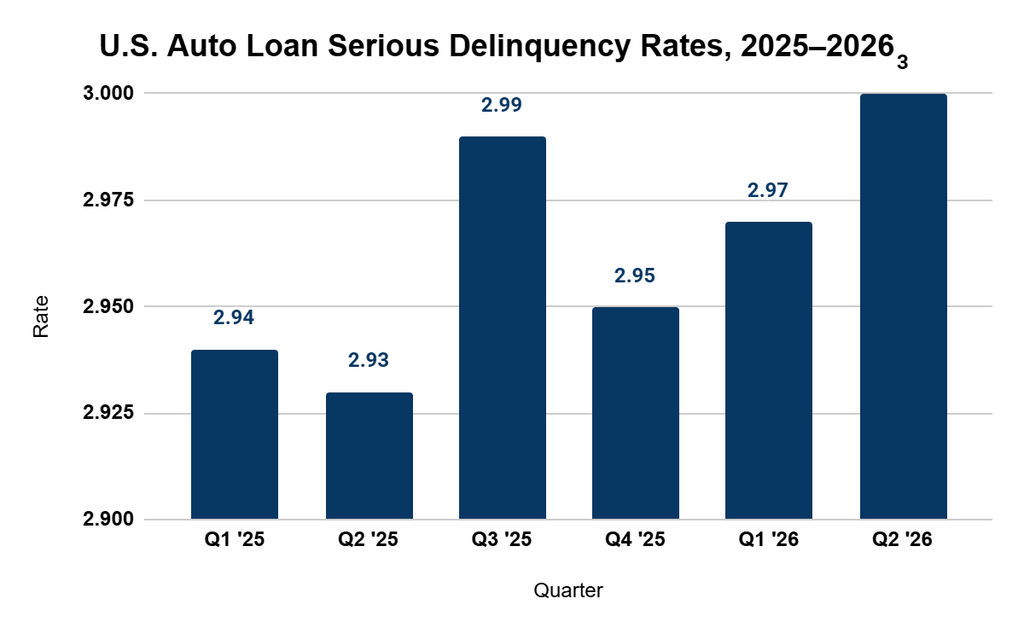
- National serious-delinquency transitions rose slightly. The annualized rate reached 3.00% in Q2 2026, up from 2.93% a year earlier.
- Subprime ABS pools showed weaker performance than prime pools. They had substantially higher delinquency and net-loss rates, alongside lower recoveries.
- Younger borrowers had the highest serious-delinquency transition rate. Borrowers ages 18–29 recorded an approximate four-quarter rate of 4.9% of auto loan balances.
- Credit union auto delinquency remained nearly flat. The rate edged down to 0.81%, while overall credit union loan delinquency rose.
- Portfolio analysis can guide lender responses. Tracking delinquency and losses by credit tier, origination vintage, payment burden, and vehicle type can identify where underwriting or servicing reviews may help.
National Auto Loan Delinquency Rates Edge Higher
The annualized rate of U.S. auto loan balances transitioning into serious delinquency, defined as 90 or more days past due, reached 3.00% in Q2 2026, according to the New York Fed. That was up slightly from 2.93% earlier in Q2 2025.
Source 1 | Source 2 | Source 3 | Source 4 | Source 5
The year-over-year increase widened from 3 basis points in Q1 to 7 basis points in Q2 2026. Monthly payments also rose. Experian reported that the average payment for a new vehicle reached $765 in Q2, up $16 from a year earlier, while the average payment for a used vehicle rose $10 to $542. Higher payments may add to affordability pressure, but the cited data do not establish that they caused the increase in serious delinquency.
What this means for lenders in 2026
- Identify which segments account for the increase. Group loans by credit tier and origination quarter, then compare their transitions into serious delinquency at the same number of months after origination. This helps distinguish weaker loan performance from changes in portfolio composition or age.
- Test whether payment burden is associated with delinquency. Within similar credit tiers and loan terms, group accounts by payment-to-income ratio at origination. Compare delinquency rates across those bands to see whether higher payment burdens coincide with weaker repayment performance.
- Measure whether earlier outreach helps. In a segment with rising early-stage delinquency, test earlier contact against the existing approach using comparable account groups. Track cure rates and movement into 60- and 90-day delinquency to assess whether the change improves repayment outcomes.
Share of Auto Loan Balances 90 or More Days Past Due Declines
The share of outstanding auto loan balances at least 90 days past due fell from 5.60% in Q1 to 5.49% in Q2 2026, according to the New York Fed. It remained 0.50 percentage point above the 4.99% recorded a year earlier.
This quarterly decline can coexist with the year-over-year increase in the annualized transition rate described above. The transition rate measures balances newly entering serious delinquency during a quarter. The quarter-end share includes all outstanding balances at least 90 days past due, including those that became seriously delinquent in earlier quarters.
The share can fall as overdue balances cure, pay down, or otherwise leave the category, or as total auto loan balances grow. Thus, a lower share does not, by itself, establish that fewer balances are becoming seriously delinquent.
What this means for lenders in 2026
- Reconcile what entered and left serious delinquency. Start with the prior quarter’s 90-day-plus balance, add newly seriously delinquent balances, and subtract cures, payments, charge-offs, and other exits. This shows which movements explain the change in overdue balances.
- Check whether portfolio growth lowered the share. Compare the dollar amount of 90-day-plus balances with total outstanding auto balances in both quarters. A falling delinquency percentage alongside flat or rising delinquent dollars may reflect growth in the denominator.
- Distinguish repayment improvement from loss recognition. Separate accounts that returned to current status or paid off from balances removed through charge-offs or repossession-related transfers. Track whether cured accounts remain current in subsequent months before treating the decline as sustained improvement.
Subprime Auto ABS Delinquency Far Exceeds Prime Rates
Delinquency in subprime auto asset-backed securities (ABS) pools rose in July 2026 after easing earlier in the year. Fitch Ratings reported a 60-day-plus delinquency rate of 6.13% for subprime pools, compared with 0.49% for prime pools. The subprime rate increased 33 basis points from June; the prime rate rose 1 basis point.
| Fitch auto ABS measure | Prime | Subprime |
| 60+ day delinquency, year-end 2025 | 0.54% | 6.50% |
| 60+ day delinquency, June 2026 | 0.48% | 5.80% |
| 60+ day delinquency, July 2026 | 0.49% | 6.13% |
| Annualized net losses, mid-2026 | 0.49% | 8.42% |
| Recovery rate, July 2026 | 59.0% | 38.0% |
Fitch said tax refunds had supported used-vehicle demand and recoveries before that boost faded into summer. It attributed the divergence between prime and subprime performance to affordability pressures weighing more heavily on lower-income, highly leveraged borrowers.
Subprime pools also recorded higher net-loss rates and lower recoveries. At midyear, the annualized subprime net-loss rate was about 17 times the prime rate. July recovery rates were 38% for subprime pools and 59% for prime pools, a gap of 21 percentage points. Fitch attributed weaker subprime recoveries partly to the pools’ greater concentration of older, higher-mileage vehicles.
What this means for lenders in 2026
- Check whether seasonal improvement lasts. Track monthly delinquency, cure rates, and recoveries by credit tier. Compare the months after tax-refund season with the same months in prior years to distinguish recurring seasonal relief from sustained improvement.
- Identify which collateral produces weaker recoveries. Group defaulted loans by vehicle age, mileage, loan-to-value ratio, and origination vintage. Compare recovery proceeds after repossession and sale costs with outstanding balances to identify where losses are concentrated.
- Test pricing and collateral assumptions against actual losses. For comparable groups of loans, compare realized net losses and recoveries with the assumptions used in your loan pricing model and collateral valuations at origination. Investigate persistent gaps before revising pricing, advance limits, or underwriting criteria.
Younger Borrowers Have the Highest Serious-Delinquency Transition Rate
Borrowers ages 18–29 had the highest rate of transition into serious auto loan delinquency in Q2 2026, according to the New York Fed. Their rate was 4.83% of auto loan balances, compared with 3.91% for borrowers ages 30–39.
| Borrower age | Q2 2025 transition rate | Q2 2026 transition rate | Year-over-year change, percentage points |
| 18–29 | 4.90% | 4.83% | −0.07 |
| 30–39 | 3.96% | 3.91% | −0.05 |
| 40–49 | 2.81% | 2.79% | −0.03 |
| 50–59 | 2.08% | 2.19% | +0.11 |
| 60–69 | 1.43% | 1.77% | +0.34 |
| 70+ | 2.00% | 2.45% | +0.44 |
The Q2 2026 rate declined across successive age groups through ages 60–69, then rose among borrowers 70 and older. The youngest group’s rate was about 2.7 times the rate for borrowers ages 60–69 and more than twice the rate for those in their 50s.
Year-over-year changes differed by age. Rates declined slightly among borrowers under 50 but increased among older groups. Borrowers 70 and older recorded the largest increase, approximately 0.44 percentage points, followed by borrowers ages 60–69 at 0.34 percentage points.
These figures show where performance changed, but they do not explain why. Lenders need to examine borrower and loan characteristics to understand the patterns in their own portfolios.
What this means for lenders in 2026
- Investigate the loan characteristics behind age-group differences. Within each age band, compare delinquency by credit history, payment-to-income ratio, loan term, and origination vintage. Then compare loans with similar characteristics across age bands to see whether differences narrow.
- Distinguish changing portfolio composition from weaker performance. Compare successive vintages at the same number of months after origination. Check whether a higher delinquency rate coincides with a larger share of loans carrying higher payment burdens or longer terms.
- Base interventions on the factors identified. If repayment difficulties cluster around high payment burdens or particular loan structures, review accounts sharing those characteristics across all age groups. Use age patterns to guide aggregate analysis, and base individual underwriting and servicing decisions on permissible credit factors.
Credit Union Auto Loan Delinquency Holds Steady
Auto loan delinquency at federally insured credit unions was 0.81% in Q2 2026, down 1 basis point from a year earlier, according to the National Credit Union Administration (NCUA). The overall delinquency rate across credit union loans rose 6 basis points to 0.96%.
| Credit union loan category | Q2 2026 delinquency rate | Year-over-year change |
| Auto loans | 0.81% | −1 bp |
| All loans | 0.96% | +6 bps |
Auto loan delinquency remained nearly unchanged despite the increase in the overall rate. Used auto loans accounted for about two-thirds of credit union auto balances, totaling $324.7 billion, compared with $160.7 billion in new auto loans. These balance figures describe portfolio composition; they do not establish which segment had higher delinquency.
The NCUA’s auto delinquency rate measures the share of outstanding auto loan balances at least 60 days past due at quarter-end. The New York Fed’s 3.00% figure is an annualized rate of balances newly transitioning into 90-day-plus delinquency. The different thresholds, loan populations, and measurement methods prevent a direct comparison.
What this means for lenders in 2026
- Build a comparable credit union benchmark. Divide your quarter-end auto loan balances at least 60 days past due by total outstanding auto loan balances. Compare that rate and its year-over-year change with the NCUA figures.
- Check whether the combined rate masks differences between new and used loans. Calculate delinquency rates separately for each portfolio, then break them down by origination vintage and loan-to-value band. Review both rates and delinquent dollars to identify which segments contribute most.
- Check whether stable delinquency also means stable losses. Compare net charge-offs and recoveries for new and used loans over the same periods. If losses rise while delinquency stays flat, review charge-off timing and recovery and remarketing performance to understand the difference.
Future-Proof Auto Lending Against Delinquency Risk with defi
The auto loan delinquency statistics in 2026 point to growing repayment pressure, particularly among subprime borrowers. For lenders, the findings offer an opportunity to revisit underwriting assumptions, assess portfolio exposure, and identify where servicing strategies may need adjustment.
The right technology can make these efforts easier to manage. defi SOLUTIONS helps auto lenders streamline loan origination and servicing workflows, giving teams the tools to manage loans throughout their lifecycle. To explore how defi can support your lending operations, book a demo.
Frequently Asked Questions About Auto Loan Delinquency Statistics
What is the difference between a delinquency rate and a default rate?
A delinquency rate measures loans with overdue payments, typically grouped by how many days they are past due. A default rate measures loans that meet a lender’s or reporting framework’s criteria for default. Not every delinquent loan defaults. Some borrowers catch up on payments, enter repayment arrangements, or otherwise resolve overdue balances.
Which indicators can help lenders identify auto loan delinquency risk earlier?
Early-stage delinquency rates, payment-to-income ratios, and transitions between delinquency stages can provide warning signs before an account becomes seriously overdue. Lenders can also review missed-payment frequency, repayment arrangements, and prior collection outcomes to spot patterns that warrant closer attention.
How do longer auto loan terms affect delinquency risk?
Longer terms generally reduce monthly payments but extend the repayment period and can slow principal reduction. Borrowers may remain in negative equity longer, particularly when vehicle values decline faster than loan balances. Lenders can evaluate these risks by examining loan-to-value ratios, remaining terms, and payment performance across different loan structures.
Why might auto loan delinquency, charge-off, and recovery trends move differently?
They measure different points in the loss process. Delinquency tracks past-due loans, charge-offs reflect loans recognized as losses, and recoveries reflect amounts recouped later. Collection timelines and collateral proceeds can cause these measures to change at different rates.
Getting Started
defi SOLUTIONS is redefining loan origination with software solutions and services that enable lenders to automate, streamline, and deliver on their complete end-to-end lending lifecycle. Borrowers want a quick turnaround on their loan applications, and lenders want quick decisions that satisfy borrowers and hold up under scrutiny. For more information on auto loan delinquency statistics, contact our team today and learn how our cloud-based loan origination products can transform your business.


